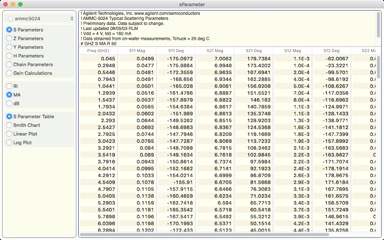
sParameter is a macOS utility aid for reviewing and understanding RF/microwave device s-parameter files. sParameter reads industry standard Touchstone® formatted files and then enables the user to convert between Z, Y, H, or ABCD (chain) parameters. In addition, standard Rollett's K and gain conversions such as available gain or transducer gain can be calculated and shown in a table or plotted. S-parameter data can be plotted on a Smith Chart or as linear or logarithmic functions on regular graphs to visually express the device performance over frequency. The calculated data can be saved for later examination and use.
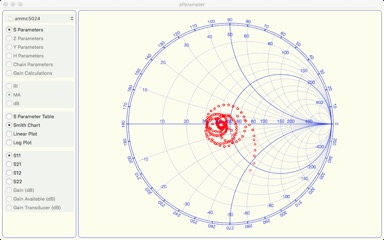
The screenshot above illustrates plotting S11 on a Smith Chart. In the Smith Chart mode, any s-parameter can be plotted (although only S11 and S22 are meaningful). Since the S plane is only useful for normalized parameters, only s-parameters can be displayed in the Smith Chart mode.
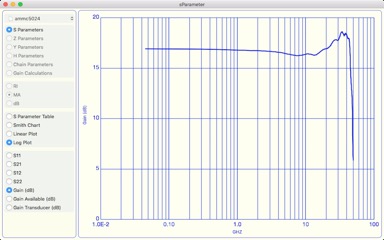
In addition to the Smith Chart, the s-parameter data can be displayed as a linear or logarithmic function of frequency. The data to be plotted as a logarithmic plot includes S11, S12, S21, S22 and three power gain parameters; power gain, available power gain, and transducer power gain. The graphic at the right illustrates gain plotted as a logarithmic function of frequency.
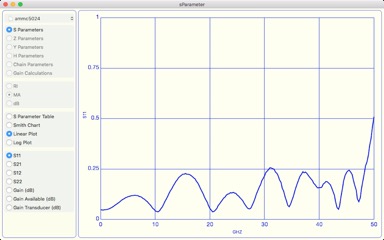
Similarly, data can be plotted as a linear function of frequency. The graphic at the right illustrates the same S11 data plotted as a linear function of frequency.
The latest version of sParameter includes many stability improvements, speed improvements, and macOS dark mode.
sParameter is available on the Apple App store at sParameter.